Need Help
If you need help setting up services or accessing your accounts, please call our Customer Care Team at 866.552.9172 during business hours (7 a.m. — 5 p.m. PST, M-F) or email us at CustomerCare@AgWestFC.com.
Location
If you need help setting up services or accessing your accounts, please call our Customer Care Team at 866.552.9172 during business hours (7 a.m. — 5 p.m. PST, M-F) or email us at CustomerCare@AgWestFC.com.
Location
If you need help setting up services or accessing your accounts, please call our Customer Care Team at 866.552.9172 during business hours (7 a.m. — 5 p.m. PST, M-F) or email us at CustomerCare@AgWestFC.com.
Securely update and exchange balance sheet information with your AgWest team.
Put your idle cash to work with a suite of banking services that sweeps funds between accounts. Fees apply.
March 12, 2025
Gross Domestic Product (GDP) in the U.S. increased by 2.3% compared to the previous year. While this represents a slowdown from 3.1% in Q3 2024, it is still signaling a healthy economy. A surge of year-end consumer spending drove the growth during this holiday season. This brings 2024 growth to 2.8%, nearly even with 2023’s 2.9%. The U.S. economy has posted growth above 2% for 9 out of the last 10 quarters.
The Atlanta Fed Tracker is showing a contraction of 2.8% in Q1 2025 as of March 3, 2025, due to a rise in trade deficits in January. Companies frontloaded imports ahead of the new year to avoid tariffs. GDP estimates from other sources continue to forecast growth, but they do not include the new trade data.
While the Personal Consumption Expenditure (PCE) price index slowed to 2.5% in January, the Consumer Price Index (CPI) accelerated for the fourth consecutive month to reach 3%, suggesting inflationary pressures remain. While lower than expected job gains occurred in February, the unemployment rate and hourly earnings growth remained generally steady at 4.1% and 4%, respectively. Continued inflation and a strong job market will make it harder for the Fed to justify lower rates.
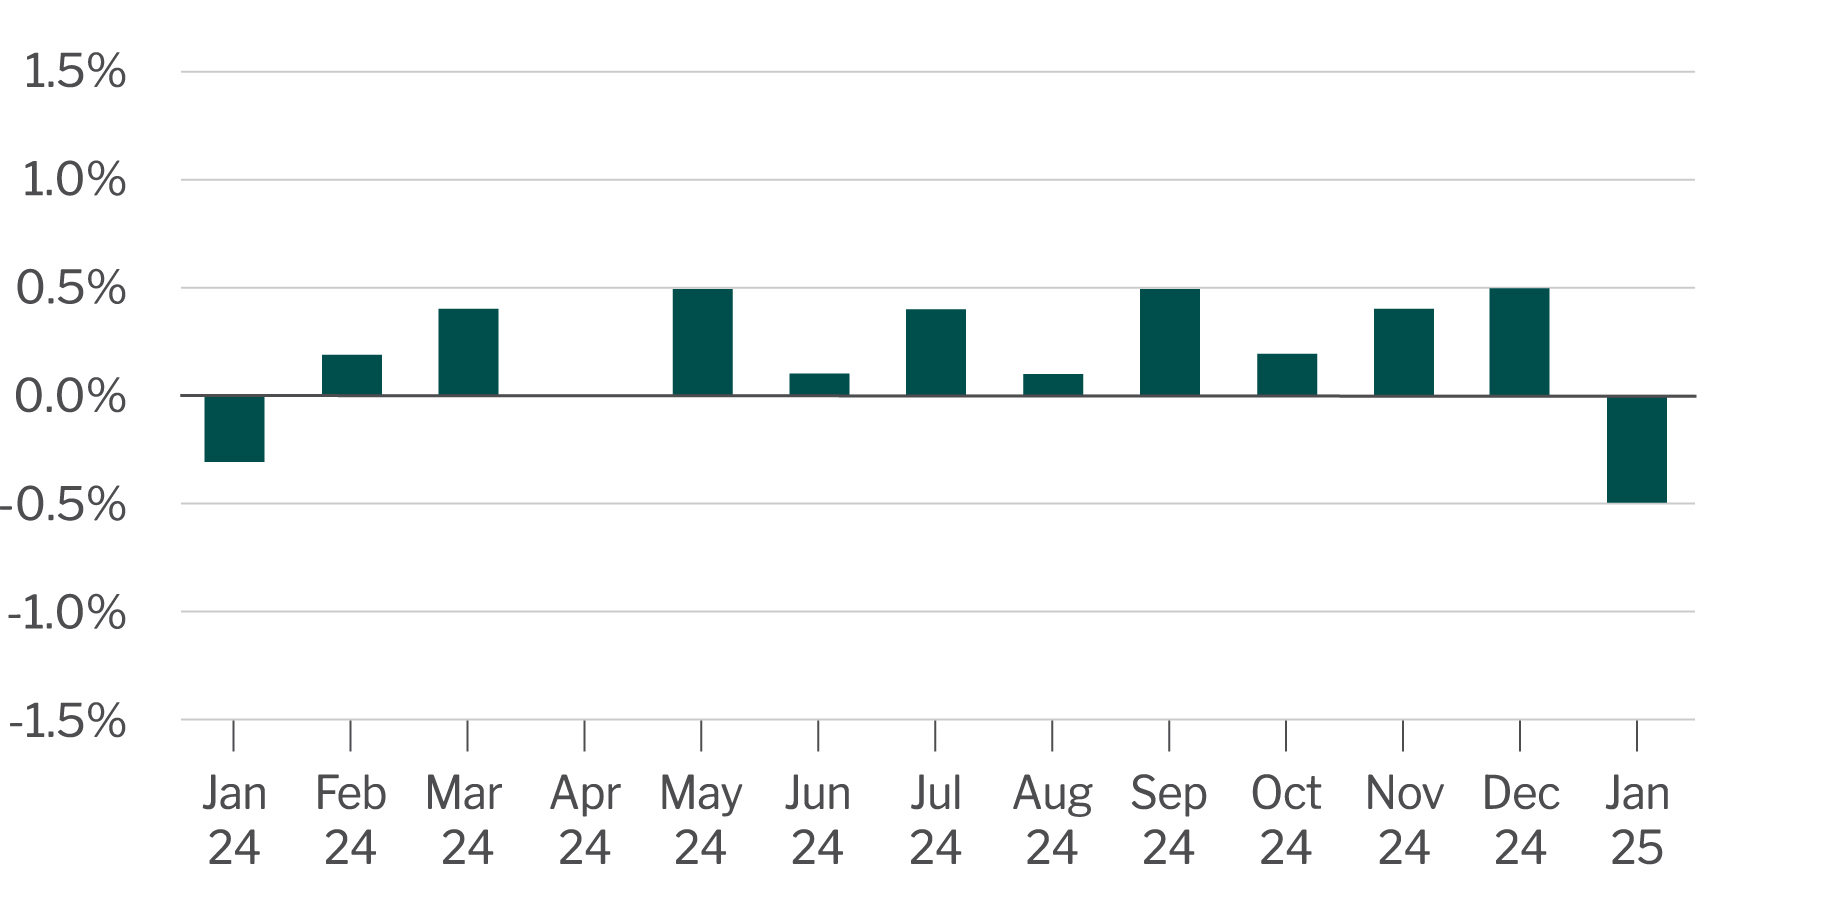
Despite easing inflation, consumer spending fell 0.5% after adjusting for inflation. This is the largest monthly fall since February 2021. Retail sales followed suit, dropping by the most in two years. While consumers normally pull back spending after the holidays, this drop was larger than expected. Hurricanes, wildfires, higher inflation expectations and an uncertain political environment have impacted consumer confidence.
Changes in consumer spending

Source: Bureau of Economic Analysis / Federal Reserve Economic Data.
This section presents select economic indicators to help producers gauge the direction of their business. These metrics reflect current market dynamics and their potential impact on operations. Come back each month to stay informed and adapt swiftly to the ever-changing economic landscape.
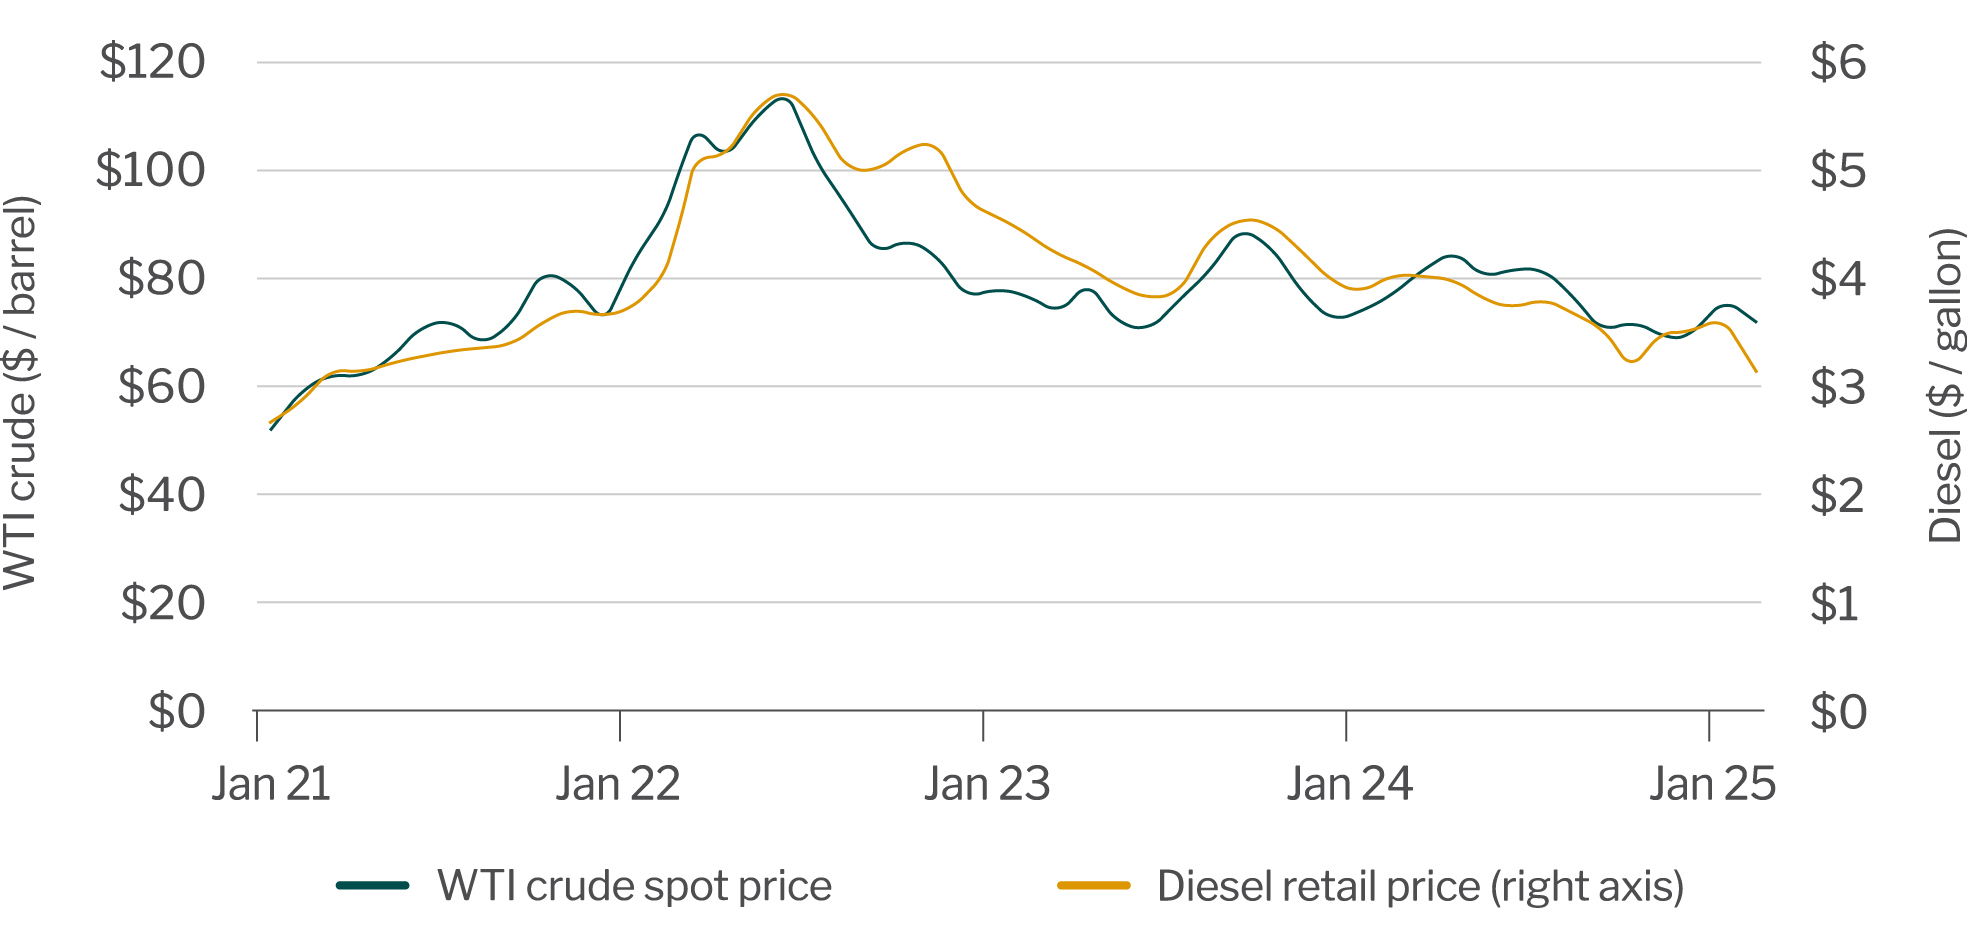
WTI crude oil and diesel prices

Source: U.S. Energy Information Agency.
Observation: Oil prices fell month over month due to anticipated supply increases from both OPEC+ and non-OPEC+ members as well as lower demand from weakening economic activity. De-escalating tensions between the U.S. and Russia should help to normalize trade flows and further reduce demand.
About this indicator: The West Texas Intermediate (WTI) crude oil price is a benchmark for oil pricing and influences the cost of fuels like diesel, which is essential for running farm equipment and transporting goods.
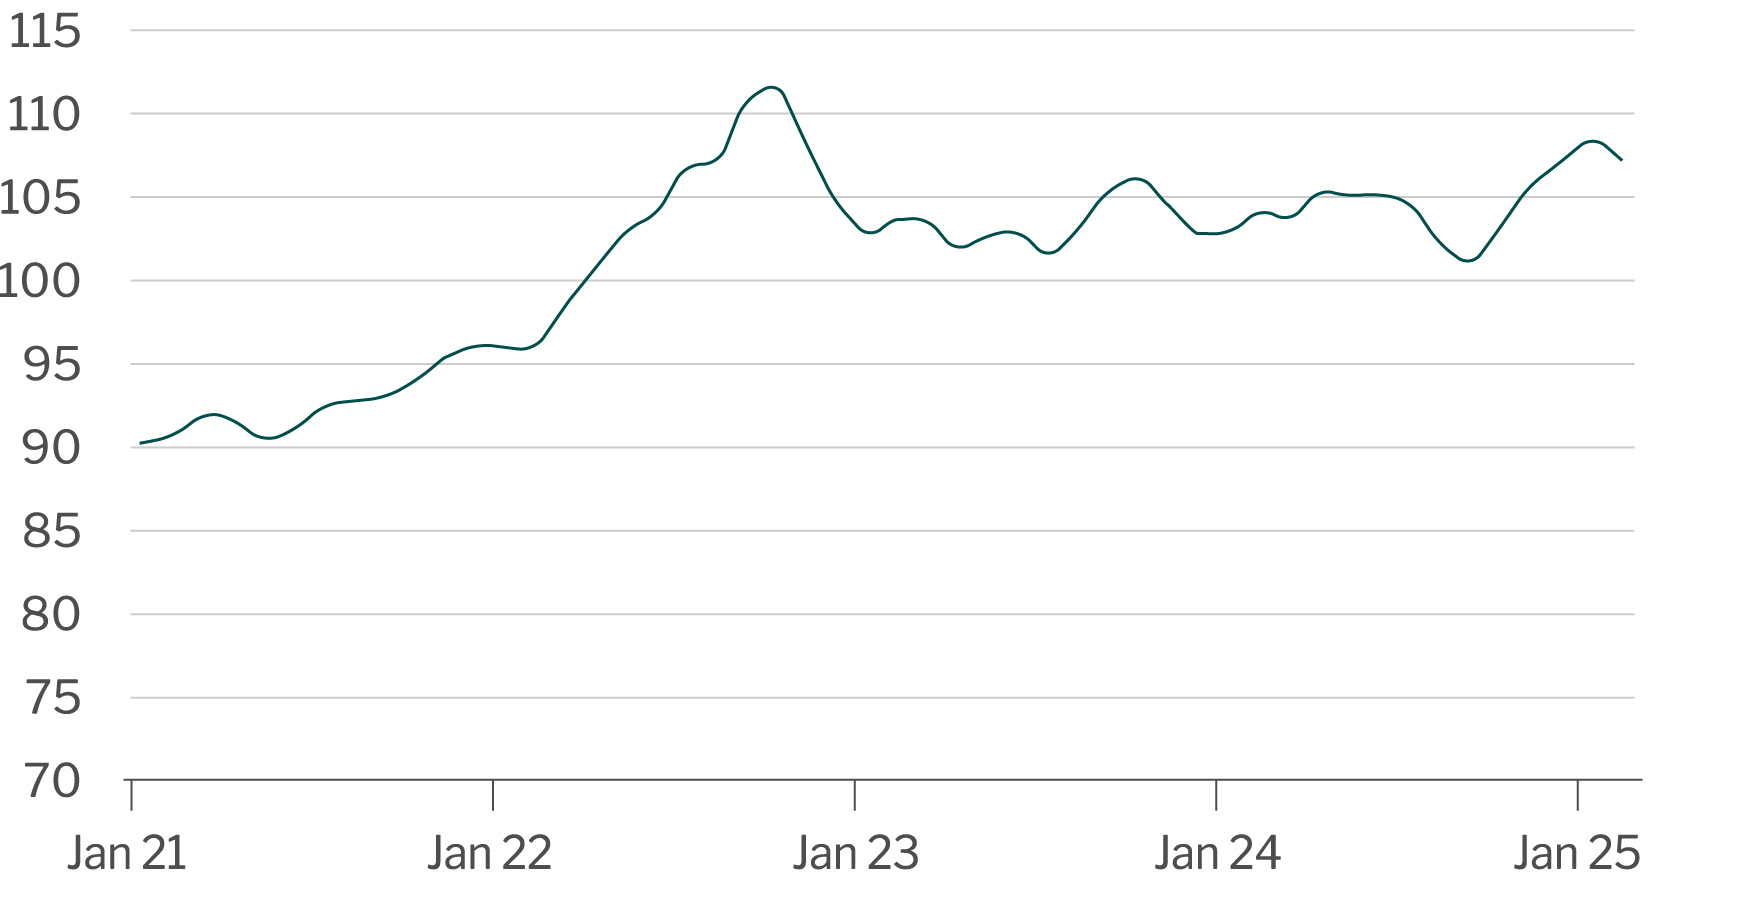
DXY Index

Source: Bloomberg.
Observation: The dollar weakened in February and into the first week in March due primarily to escalating trade tensions and weaker than expected economic data in the U.S. Other factors may include narrowing yields between the U.S., Japan and Europe and recent commitments by Europe to increase defense spending.
About this indicator: The DXY index measures the strength of the U.S. dollar against a basket of foreign currencies. The strength of the U.S. dollar impacts the competitiveness of agriculture producers in foreign markets. As the dollar strengthens, U.S. producers & exports become less competitive, and vice versa.
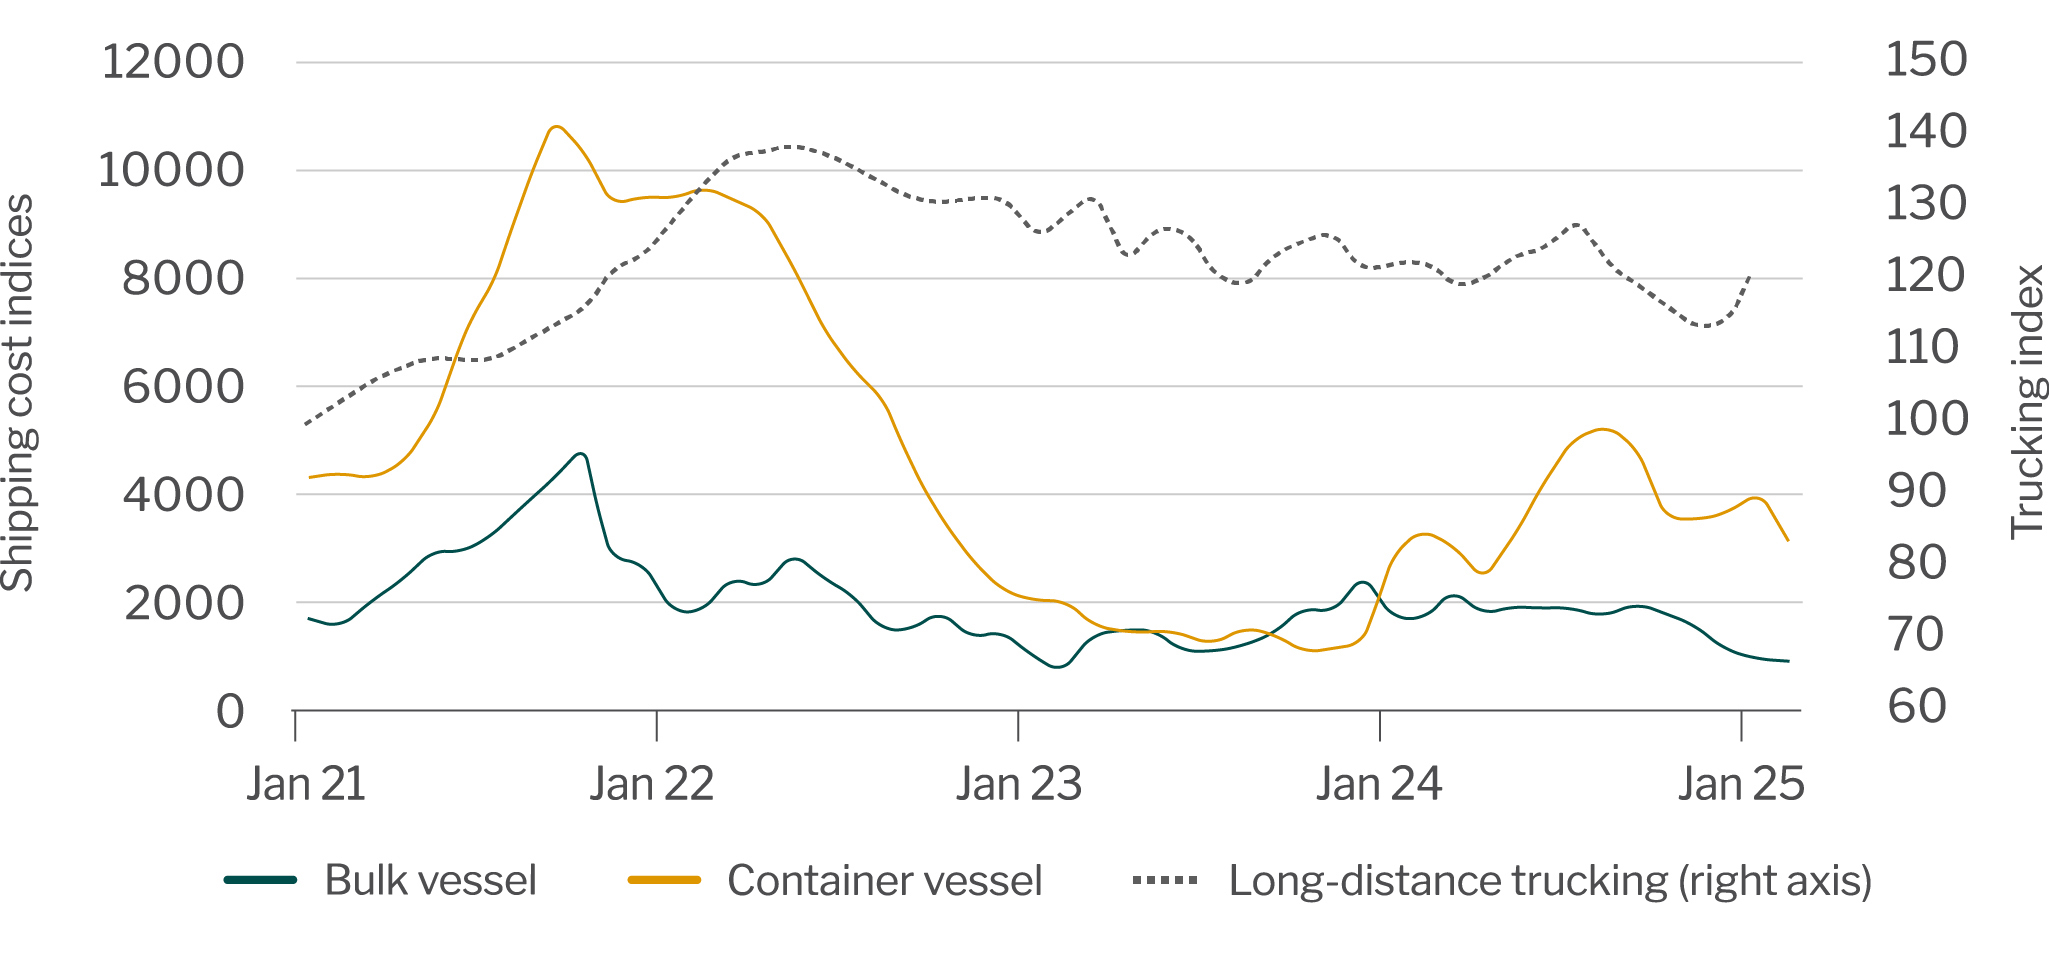
Transportation price indices

Source: Bloomberg. Freightos. U.S. Bureau of Labor Statistics.
Observation: Weakening global economic conditions, increasing risk of tariffs, de-escalation between the U.S. and Russia, lower prospects of vessel attacks in the Red Sea and the conclusion of the Lunar New Year in China are weighing on shipping rates. Seasonal trends along with softness in manufacturing activity and retail sales are weighing on trucking demand.
About this indicator: The long-haul trucking index measures the changes in trucking freight rates over time. The Baltic Dry Index measures the average global cost of shipping bulk materials, including grains, sugar, metals, and others. The container index measures the average global cost of shipping containers. Shipping prices vary by route and carrier size based on market dynamics and may move independently from global averages (i.e., the cost to ship goods from the West Coast to Asia could remain flat even if global rates are increasing).
Go to Industry Insights homepage
IN THIS SECTION
![]()

Economic growth has exceeded most expectations over the past several quarters as consumers maintain spending levels.
Learn more.jpg?sfvrsn=bc72c53a_1)
Access monthly updates on top commodities and the economy, plus special reports on profitability, land values and drought.
Learn more